 View full size ↗
The work you do every day changes lives. The reporting your funders and your board receive may understate that — because the data is often scattered, indicators sometimes carry over from prior program officers, and analyst capacity isn't always there to assemble it. ClearWind.AI's outcomes module connects the work you're already logging in case management, clinical, and grants to the indicators your funders care about.
Your case managers are documenting their work. Your clinicians are logging encounters. Your volunteer coordinator is tracking hours. Your development team is recording donor outcomes. Somewhere in all that activity is the answer to the question every funder asks: did the program work?
The work is usually delivering. The evidence often isn't — buried in spreadsheets, fragmented across tools, locked in the head of the program manager who's now on leave. So organizations write impact stories instead. The stories are true, but they're not the same as data. Funders accept them and ask politely for the data the next time around.
The outcomes module is what closes that gap. Define the indicators that matter to each funder, link them to the activities your team is already doing, and the impact data assembles itself. The funder gets evidence. Your program team gets credit for the work they actually did. Your next renewal is built on numbers your board chair can defend.
View full size ↗A library of pre-built indicators for the major funder frameworks — HUD, VOCA, OVW, SAMHSA, HRSA, and a growing set of state and foundation frameworks. Indicator definitions include the unit, the target value, the verification method, and the data source. Build your own indicators for the metrics your organization cares about beyond what funders require.
A visual canvas linking inputs to activities to outputs to outcomes. Funders see your theory of change. Your program team sees how the work they do every day connects to the change they're trying to make. Logic models live with the program and update as the program evolves.
Track which constituents are enrolled in which programs. Set enrollment criteria that the case manager doesn't have to remember. Group participants into cohorts. Watch attrition and engagement at the cohort level instead of one-at-a-time.
Custom and pre-built assessment templates with scoring and outcome linkage. Survey campaigns that fire automatically at the right moments — at intake, at the six-month mark, at exit, six months after exit. Reminder cadences for the participants whose responses you need.
Pre-built outcome mappings for HUD, VOCA, OVW, SAMHSA, and other federal sources. The template knows which indicators the funder requires, how the data should be aggregated, and what counts as a success. The report draft assembles itself from the program activity logged in case management.
Case closure triggers outcome validation. Grant award creates a reporting period with the right indicators attached. Clinical assessments auto-populate program outcomes. Volunteer hours roll into match documentation. The work flows in one direction — through your team's daily activity into the funder report — not in the bureaucratic loop that requires re-entering everything.
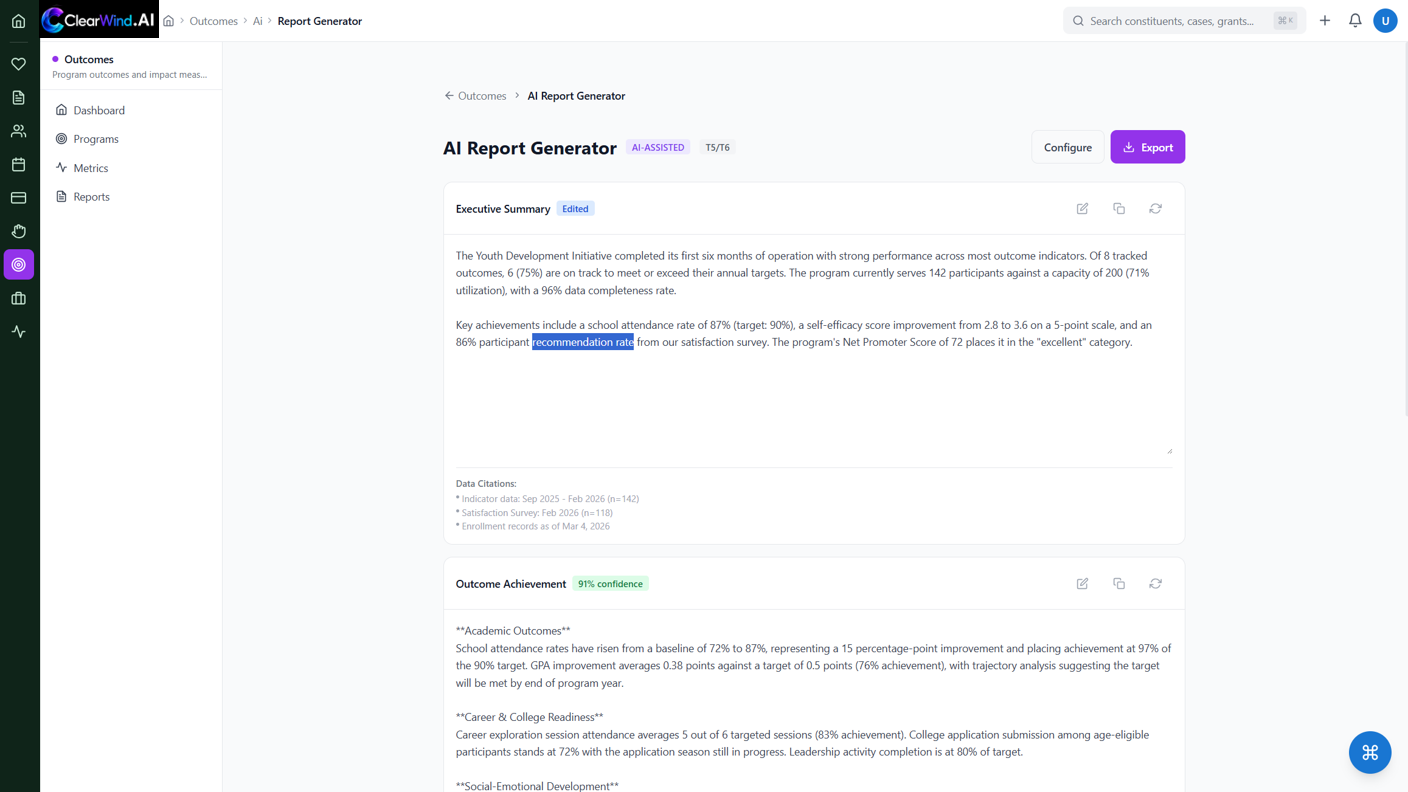
Narrative drafting. The first pass at the funder narrative — built from the actual service activity, not invented from nothing — saves the program manager hours per report. Your voice, your judgment, just faster.
Correlation discovery. Explore associations across program data to identify patterns for further review. Staff assess the context and limitations; correlations alone do not establish that an intervention caused an outcome.
Dashboard insights. Automated executive summaries on every dashboard. The system explains what changed and why, in plain English, so your board chair doesn't need a translator to understand the report.
Plain-English questions. "Show me participants who completed the workforce program last year and held employment for six months." Get the answer with the chart, in seconds.
Switching from legacy software? Our AI-assisted migration is often free. We confirm scope and any cost before you commit. Learn about Migration →